Test partner
Rail-profile wear versus simulation, Weinberg-Leonhardstrasse
VBZ shared years of rail-profile wear data for a tight Zurich curve. Traila's own simulation reproduced the same pattern, curve section by curve section.
Question
Could a vehicle-dynamics simulation find the same wear pattern an operator had spent years measuring on the ground?
VBZ shared a database of rail-profile wear measurements for the Weinberg-Leonhardstrasse section, Central to ETH: yearly measurements from 2022 to 2025, horizontal and vertical wear in millimetres, on both rails.
The section carries T2000 and Cobra trams and includes two very tight curves, both under 20 m radius, on a steep gradient.
Read on their own, three years of yearly data made it hard to see where the wear concentrated; a cumulative wear diagram built from VBZ's own numbers made sections A, B and C comparable.

What we did
Took VBZ's own rail-profile wear survey for the Weinberg-Leonhardstrasse section: yearly measurements, horizontal and vertical, left and right rail
Modelled the same track section in Simpack, carrying both the T2000 and Cobra tram models that run it
Ran a vehicle-dynamics simulation of the section and derived a wear analysis from the result
Ran the simulation at 6 km/h and 12 km/h for each tram model, holding the wheel-rail friction coefficient constant
Combined both trams' wear numbers in roughly the mix they actually share the line: about four Cobra journeys for every T2000
What we measured
The operator's own measured wear pattern across the section, sections A, B and C
Traila's simulated wear pattern for the same section, same sections, same tram models
How closely the simulated pattern held up against the simulation's own simplifications: nominal, unworn wheel and rail profiles, a constant friction coefficient, constant speed, and no traction or braking modelled
- 01
Significant, systematic wear in sections A and B, and less wear on the first sharp curve, section C, confirmed by VBZ's own data.
- 02
The simulation matched the measured pattern, simplifications notwithstanding.
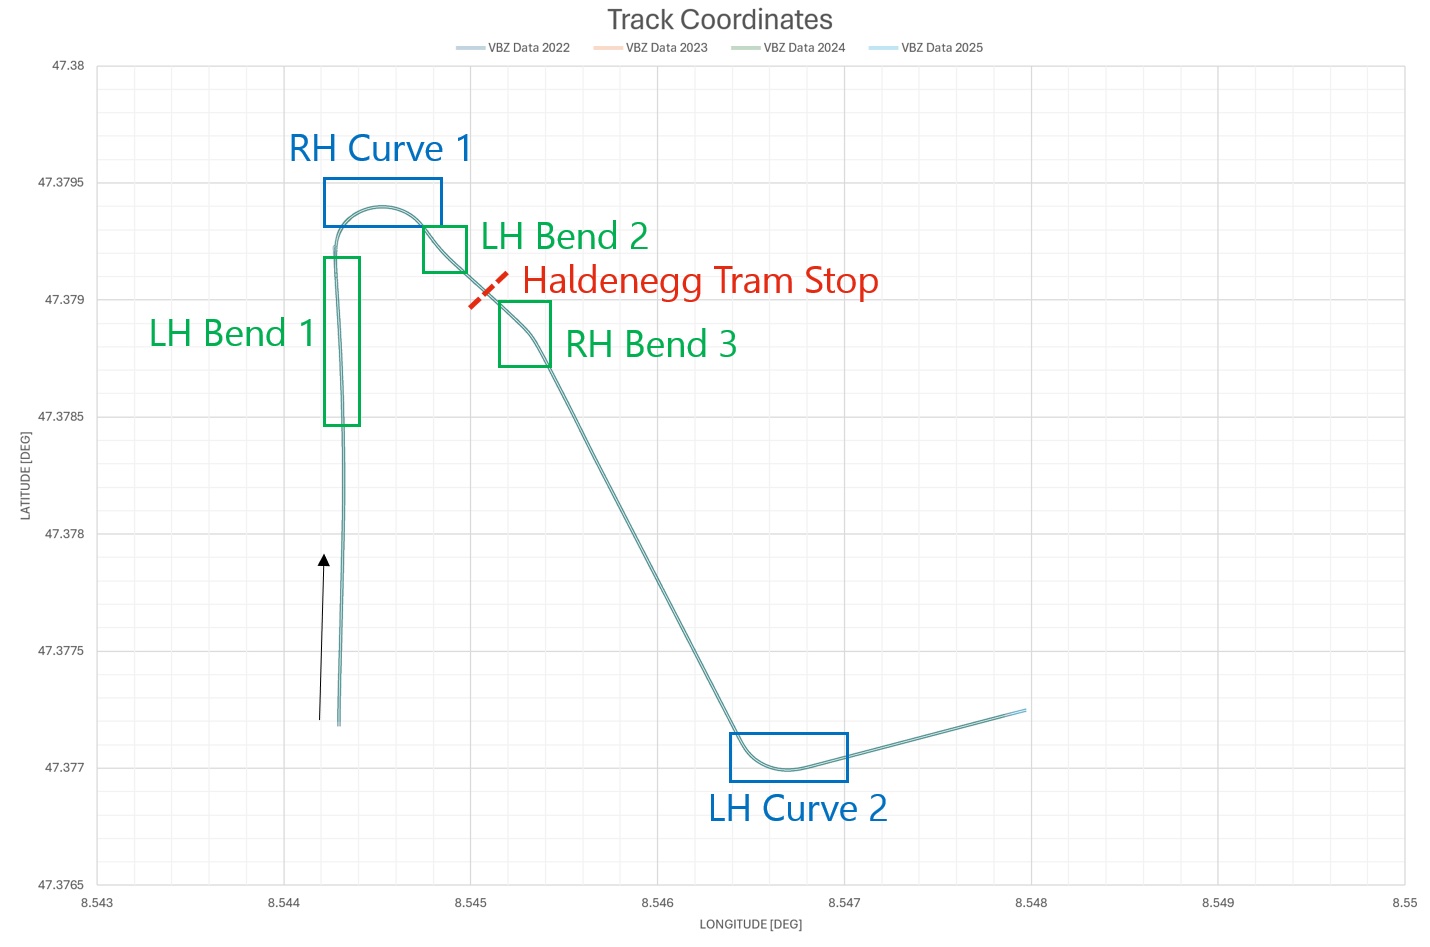
Curve map of the Weinberg-Leonhardstrasse test section. - 03
The tightest curve on the section, radius about 18 m, showed the heaviest wear; a nearby 19 m curve showed none worth noting.
- 04
The comparison shows it is possible to quantify a network's wear profile through numerical simulation, and to flag the curves that most need attention for maintenance planning or friction management.

Managing the wear
Four ways to manage wheel-rail wear, and where each falls short.
Increasing rail hardness reduces plastic deformation and lowers the risk of rolling-contact-fatigue cracks starting and spreading.
Optimising the wheel and rail profile reduces multiple contact points at the flange and flange back, and smooths the contact-patch transition through curves.
Wayside lubrication protects specific curves, but covering a whole network needs major infrastructure work, and uneven local friction can trigger polygonisation or corrugation.
On-board lubrication manages the friction coefficient continuously at the wheels, across the whole network, without any change to the infrastructure.


On-board lubrication manages the friction coefficient continuously at the wheels, across the whole network, without needing any change to the infrastructure.
Data sheets
Take the method with you
Enter your work email and the PDF unlocks here.
- Download PDF
Vehicle dynamics simulations
Vehicle modelling, wheel-rail interaction, wear analysis and profile optimisation, with the simulated effect of smart lubrication.